vol_premiaThis script shows the volatility risk premium for several instruments. The premium is simply "IV30 - RV20". Although Tradingview doesn't provide options prices, CBOE publishes 30-day implied volatilities for many instruments (most of which are VIX variations). CBOE calculates these in a standard way, weighting at- and out-of-the-money IVs for options that expire in 30 days, on average. For realized volatility, I used the standard deviation of log returns. Since there are twenty trading periods in 30 calendar days, IV30 can be compared to RV20. The "premium" is the difference, which reflects market participants' expectation for how much upcoming volatility will over- or under-shoot recent volatility.
The script loads pretty slow since there are lots of symbols, so feel free to delete the ones you don't care about. Hopefully the code is straightforward enough. I won't list the meaning of every symbols here, since I might change them later, but you can type them into tradingview for data, and read about their volatility index on CBOE's website. Some of the more well-known ones are:
ES: S&P futures, which I prefer to the SPX index). Its implied volatility is VIX.
USO: the oil ETF representing WTI future prices. Its IV is OVX.
GDX: the gold miner's ETF, which is usually more volatile than gold. Its IV is VXGDX.
FXI: a china ETF, whose volatility is VXFXI.
And so on. In addition to the premium, the "percentile" column shows where this premium ranks among the previous 252 trading days. 100 = the highest premium, 0 = the lowest premium.
Cari dalam skrip untuk "Implied volatility"

ATR 3x Multiplier StrategyBeta version
Volatility and Candle Spikes in Trading
Volatility
Volatility refers to the degree of variation in the price of a financial asset over time. It measures how much the price fluctuates and is often associated with risk and uncertainty in the market. High volatility means larger price swings, while low volatility indicates more stable price movements.
Key aspects of volatility:
Measured using indicators like Average True Range (ATR), Bollinger Bands, and Implied Volatility (IV).
Influenced by factors such as market news, economic events, and liquidity.
Higher volatility increases both risk and potential profit opportunities.
Candle Spikes
A candle spike (or wick) refers to a sudden price movement that forms a long shadow or wick on a candlestick chart. These spikes can indicate strong buying or selling pressure, liquidity hunts, or stop-loss triggers.
Types of candle spikes:
Bullish Spike (Long Lower Wick): Indicates buyers rejected lower prices, pushing the price higher.
Bearish Spike (Long Upper Wick): Suggests sellers rejected higher prices, pushing the price lower.
Stop-Loss Hunt: Market makers may trigger stop-losses by creating artificial spikes before reversing the price.
News-Induced Spikes: Economic data releases or unexpected events can cause sudden price jumps.
Understanding volatility and candle spikes can help traders manage risk, spot entry/exit points, and avoid false breakouts. 🚀📈

SPX Expected MoveThis indicator plots the "expected move" of SPX for today's trading session. Expected move is the amount that SPX is predicted to increase or decrease from its current price, based on the current level of implied volatility. The implied volatility in this indicator is computed from the current value of the VIX (or one of several volatility symbols available on Trading view). The computation is done using standard formula. The resulting plots are labeled as 1 and 2 standard deviations. The default values are to use VIX as well as 252 trading days in the years.
Use the square root of (days to expiration, or in this case a fraction of the day remaining) divided but the square root of (252, or number of trading days in a year).
timeRemaining = math.sqrt(DTE) / math.sqrt(252)
Standard deviation move = SPX bar closing price * (VIX/100) * timeRemaining

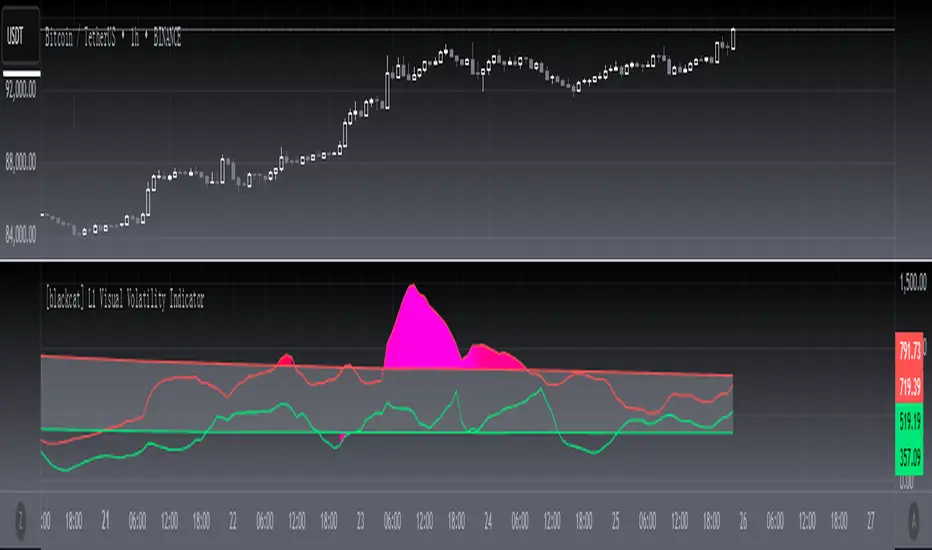
[blackcat] L1 Visual Volatility IndicatorHey there! Let's get into the details about dynamic rate indicators, how they work, their importance, usage, and benefits in trading.
Dynamic rate indicators are essential in trading as they help traders assess the volatility and risk level of the market, so they can make the right trading strategies and risk management measures.
When it comes to the importance of dynamic rate indicators, they provide critical information about market volatility, which is super important for traders. Traders can use this information to understand the risk level of the market, determine market stability and instability, and adjust trading strategies based on volatility changes.
Now let's talk about the usage of dynamic rate indicators. They have different usage times for different trading strategies and market environments. Generally, when market volatility is low, traders can take advantage of the opportunity to do trend tracking or oscillating trades. When market volatility is high, traders can take a more conservative approach, such as using stop-loss orders or reducing position sizes.
Using dynamic rate indicators can bring several benefits. First, they can help traders evaluate the risk level of the market, so they can develop suitable risk management strategies. Traders can adjust stop-loss and take-profit levels based on changes in volatility to control risk. Second, dynamic rate indicators provide information about market trends and price fluctuations, helping traders make wiser trading decisions. Traders can determine entry and exit points based on the signals of dynamic rate indicators. Lastly, dynamic rate indicators play a significant role in option pricing. Implied volatility helps traders evaluate option prices and market expectations for future volatility, so they can carry out option trades or hedging operations.
In conclusion, dynamic rate indicators are essential for traders as they help assess market volatility and risk levels, develop suitable trading strategies and risk management measures, and increase trading success and profitability. Remember that different indicators are suitable for different types of markets, so it is essential to choose the right one for your specific trading needs.
This indicator is a powerful tool for traders who want to stay ahead of the market and make informed trading decisions. By analyzing trends in volatility, this indicator can provide valuable insights into market sentiment and help traders identify potential trading opportunities.
One of the key advantages of the L1 Visual Volatility Indicator is its ability to adapt to changing market conditions. The channel structure it constructs based on ATR characteristics provides a framework for tracking volatility that can be adjusted to different timeframes and asset classes. This allows traders to customize the indicator to their specific needs and trading style, making it a versatile tool for a wide range of trading strategies.
Another advantage of this indicator is its use of gradient colors to differentiate between Bullish and Bearish volatility. This provides a visual representation of market sentiment that can help traders quickly identify potential trading opportunities and make informed decisions. Additionally, the use of Fibonacci's long-term moving average to define the sideways consolidation area provides a reliable framework for identifying key levels of support and resistance, further enhancing the indicator's usefulness in trading.
In conclusion, the L1 Visual Volatility Indicator is a powerful tool for traders looking to stay ahead of the market and make informed trading decisions. Its ability to adapt to changing market conditions and use of gradient colors to differentiate between Bullish and Bearish volatility make it a versatile and effective tool for a wide range of trading strategies. By incorporating this indicator into their trading arsenal, traders can gain valuable insights into market sentiment and improve their chances of success in the markets.
Black-Scholes Gamma Scalping Strategy# Black-Scholes Gamma Scalping Strategy
## Overview
This strategy applies options market-making principles to spot/futures trading using the Black-Scholes pricing model. It simulates the behavior of a delta-hedged straddle position, generating buy and sell signals based on how a market maker would hedge their gamma exposure.
---
## The Concept: Gamma Scalping
Professional options traders who hold long straddles (long call + long put at the same strike) profit when the underlying moves significantly in either direction. Here's why:
- A straddle has **positive gamma**, meaning its delta increases as price rises and decreases as price falls
- To stay delta-neutral, traders must **buy after dips** and **sell after rallies**
- If **realized volatility > implied volatility**, the profits from these hedging trades exceed the daily theta (time decay) cost
This strategy captures that edge by:
1. Calculating theoretical Greeks using Black-Scholes
2. Monitoring when delta deviates from neutral
3. Trading to "hedge" back to neutral — buying weakness, selling strength
---
## Black-Scholes Greeks Calculated
| Greek | Symbol | What It Measures |
|-------|--------|------------------|
| Delta | Δ | Directional exposure |
| Gamma | Γ | Rate of delta change |
| Vega | ν | Sensitivity to volatility |
| Theta | Θ | Time decay per day |
All Greeks are calculated in real-time using the standard Black-Scholes formula with configurable inputs for strike, expiration, implied volatility, and risk-free rate.
---
## Entry Signals
**Long Entry** (buy the underlying):
- Price drops significantly (gamma scalp trigger), OR
- Straddle delta falls below the lower hedge band
- Volatility filter confirms favorable regime (HV > IV)
**Short Entry** (sell the underlying):
- Price rises significantly (gamma scalp trigger), OR
- Straddle delta rises above the upper hedge band
- Volatility filter confirms favorable regime
---
## Volatility Regime Filter
The strategy compares **Historical Volatility (HV)** to **Implied Volatility (IV)**:
- **HV/IV > 1.2** → Long volatility regime (gamma scalping profitable) → Trading enabled
- **HV/IV < 0.8** → Short volatility regime (theta wins) → Trading paused or reversed
- **Between** → Neutral, proceed with caution
This filter helps avoid trading when market conditions don't favor the strategy.
---
## Key Inputs
**Option Parameters:**
- Strike Offset % — Distance from ATM (0 = at-the-money)
- Days to Expiration — Synthetic option tenor (affects gamma magnitude)
- Implied Volatility — Your estimate of fair IV
- Risk-Free Rate — For BS calculation
**Trading Parameters:**
- Gamma Scalp Threshold — ATR multiple to trigger trades
- Delta Hedge Band % — How far delta must deviate to signal
- Volatility Regime Filter — Enable/disable HV/IV filter
**Risk Management:**
- Stop Loss / Take Profit (ATR multiples)
- Max Drawdown % — Pauses trading if exceeded
- Max Concurrent Positions
---
## How to Use
1. **Set Implied Volatility** to match current market IV (check options chain or VIX for reference)
2. **Adjust Days to Expiration** — Shorter = higher gamma, more signals; Longer = smoother
3. **Tune the Hedge Band** — Tighter bands = more trades; Wider = fewer, larger moves
4. **Enable Volatility Filter** for trend-following vol regimes, disable for pure mean-reversion
**Best suited for:**
- Range-bound or choppy markets
- High realized volatility environments
- Liquid instruments with tight spreads
**Avoid using when:**
- Strong directional trends (gamma scalping loses to delta)
- Volatility is collapsing
- Low liquidity / wide spreads
---
## Information Table
The on-chart table displays real-time:
- Current strike price
- Straddle Delta, Gamma, Vega, Theta
- Historical vs Implied Volatility
- HV/IV Ratio
- Current volatility regime
---
## Alerts
Built-in alert conditions for:
- Long entry signals
- Short entry signals
- Max drawdown protection triggered
---
## Disclaimer
This strategy is provided for **educational purposes only**. It demonstrates how Black-Scholes option pricing theory can be applied to generate trading signals.
- Past performance does not guarantee future results
- Backtest results may not reflect live trading conditions
- Always use proper position sizing and risk management
- Paper trade extensively before using real capital
**No financial advice is given or implied.**
---
## Credits
Based on the Black-Scholes-Merton option pricing model (1973) and gamma scalping techniques used by professional options market makers.
---
*If you find this useful, please leave a like or comment. Suggestions for improvements are welcome!*

Realized Volatility (StdDev of Returns, %)📌 Realized Volatility (StdDev of Returns, %)
This indicator measures realized volatility directly from price returns, instead of the common but misleading approach of calculating standard deviation around a moving average.
🔹 How it works:
Computes close-to-close log returns (the most common way volatility is measured in finance).
Calculates the standard deviation of these returns over a chosen lookback period (default = 200 bars).
Converts results into percentages for easier interpretation.
Provides three key volatility measures:
Daily Realized Vol (%) – raw standard deviation of returns.
Annualized Vol (%) – scaled by √250 trading days (market convention).
Horizon Vol (%) – volatility over a custom horizon (default = 5 days, i.e. weekly).
🔹 Why use this indicator?
Shows true realized volatility from historical returns.
More accurate than measuring deviation around a moving average.
Useful for traders analyzing risk, position sizing, and comparing realized vs implied volatility.
⚠️ Note:
It is best used on the Daily Chart!
By default, this uses log returns (which are additive and standard in quant finance).
If you prefer, you can easily switch to simple % returns in the code.
Volatility estimates depend on your chosen lookback length and may vary across timeframes.

4C Expected Move (Weekly Options)This indicator plots the Expected Move (EM) calculated from weekly options pricing, for a quick visual reference.
The EM is the amount that a stock is predicted to increase or decrease from its current price, based on the current level of implied volatility.
This range can be viewed as support and resistance, or once price gets outside of the range, institutional hedging actions can accelerate the move in that direction.
The EM range is based on the Weekly close of the prior week.
It can be useful to know what the weekly EM range is for a stock to understand the probabilities of the overall distance, direction and volatility for the week.
To use this indicator you must have access to a broker with options data (not available on Tradingview).
Look at the stock's option chain and find the weekly expected move. You will have to do your own research to find where this information is displayed depending on your broker.
See screenshot example on the chart. This is the Thinkorswim platform's option chain, and the Implied Volatility % and the calculated EM is circled in red. Use the +- number in parentheses, NOT the % value.
Input that number into the indicator on a weekly basis, ideally on the weekend sometime after the cash market close on Friday, and before the Market open at the beginning of the trading week.
The indicator must be manually updated each week.
It will automatically start over at the beginning of the week.

Volatility barometerIt is the indicator that analyzes the behaviour of VIX against CBOE volaility indices (VIX3M, VIX6M and VIX1Y) and VIX futures (next contract to the front one - VX!2). Because VIX is a derivate of SPX, the indicator shall be used on the SPX chart (or equivalent like SPY).
When the readings get above 90 / below 10, it means the market is overbought / oversold in terms of implied volatility. However, it does not mean it will reverse - if the price go higher along with the indicator readings then everything is fine. There is an alarming situation when the SPX is diverging - e.g. the price go higher, the readings lower. It means the SPX does not play in the same team as IVOL anymore and might reverse.
You can use it in conjunction with other implied volatility indicators for stronger signals: the Correlation overlay ( - the indicator that measures the correlation between VVIX and VIX) and VVIX/VIX ratio (it generates a signal the ratio makes 50wk high).

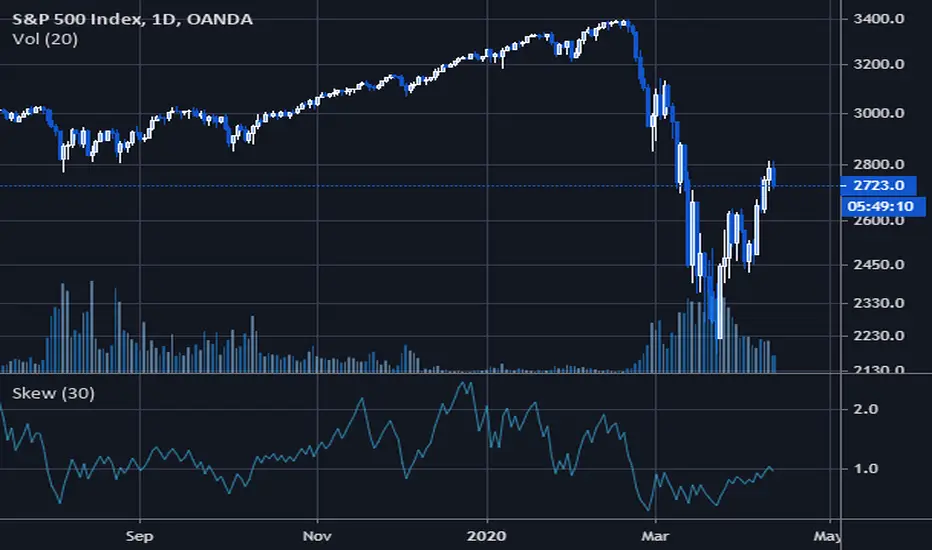
Volatility SkewThis indicator measure the historical skew of actual volatility for an individual security. It measure the volatility of up moves versus down moves over the period and gives a ratio. When the indicator is greater than one, it indicators that volatility is greater to the upside, when it is below 1 it indicates that volatility is skewed to the downside.
This is not comparable to the SKEW index, since that measures the implied volatility across option strikes, rather than using historical volatility.
(JS)S&P 500 Volatility Oscillator For Options 2.0I am going to start taking requests to open source my indicators and they will also be updated to Version 4 of Pinescript.
I added some features to the original code such the ability to smooth the oscillator and select the look back periods for the historical volatility.
Link to original:
Original post:
"The idea for this started here: www.tradingview.com with the user @dime
This should only be used on SPX or SPY (though you could use it on other things for correlation I suppose) given that the instrument used to create this calculation is derived from the S&P 500 (thank you VIX ). There's a lot of moving parts here though, so allow me to explain...
First: The main signal is when Implied Volatility (from VIX ) drops beneath Historical Volatility - which is what you want to see so you aren't purchasing a ton of premium on long options. Green and above 0 means that IV% has dropped lower than Historical Volatility . (this signal, for example, would suggest using a Long Call or Put depending on your sentiment)
Second: The green line running underneath zero is the bottom portion of the "Average True Range" derived from the values used to create the oscillator. the closer the bottom histogram is to the green line, the more "normal" IV% is. Obviously, if this gets far away from the line then it could be setting up nicely to short options and sell the IV premium to someone else. (this signal, for example, would suggest using something like a Bull Put Spread)
Third: The red background along with the white line that drops down below zero signals when (and how far) the IV% from 3 months out (from VIX3M ) is less than the current IV%. This would signal the current environment has IV way too high, a signal to short options once again (and don't take any long option positions!).
Tried to make this simple, yet effective. If you trade options on SPX , SPY , even ES1! futures - this is a tool tailored specifically for you! As I said before, if you want you can use it for correlation on other securities. Any other ideas or suggestions surrounding this, please let me know! Enjoy!
Feb 17, 2019
Release Notes: Cosmetic update for a much cleaner look:
-Replaced the "HIGH IV" with a simlple "H"
-Now the white line is constantly showing you the relationship between VIX and VIX3M - when VIX is greater than VIX3M the background still goes red
-However, now when VIX drops below Historical Volatility, the background is bright green
-When both above are true - it's dark green
-The Average True Range on the bottom is now a series of crosses"

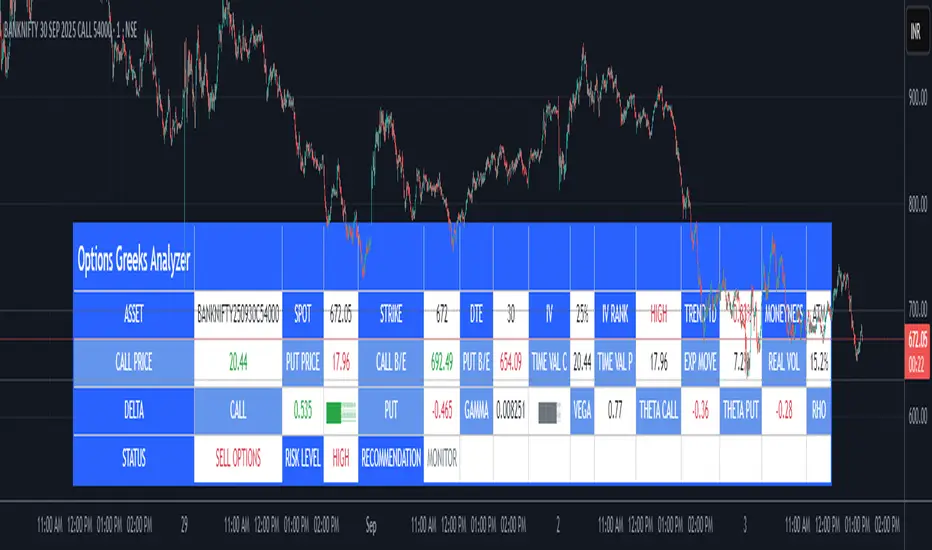
Options Greeks AnalyzerOptions Greeks Analyzer (Training & Learning Guide)
________________________________________
1. Introduction
Options trading is advanced compared to regular stock trading, and one of the most important aspects is Options Greeks. Greeks are mathematical values that measure how the price of an option will react to changes in various factors such as the underlying asset’s price, volatility, interest rates, and time to expiry.
This Options Greeks Analyzer tool is built using TradingView Pine Script v5. It serves as a real time training and analysis dashboard that helps learners visualize how options greeks behave, how option prices change, and how traders can make informed decisions.
📌 Educational Disclaimer:
This tool is only for training and learning purposes. It is not a financial advice tool nor to be used for live trading decisions. The data shown is theoretical Black Scholes model calculations, which may differ from actual option market prices.
________________________________________
2. How the Tool Works
The Options Greeks Analyzer is divided into different modules. Below is a step by step walkthrough:
________________________________________
Step 1: User Inputs
• Implied Volatility (IV%) — You can manually enter volatility, which is the most important factor in option pricing. Higher IV = higher option premium.
• Expiry Selection — Choose from preset durations like 7D, 14D, 30D etc. Days to expiry directly affect time decay (Theta).
• Strike Price Mode — You can select either:
o ATM (At-the-Money = Current price of stock/index)
o Custom strike (Enter your own strike price)
• Risk-Free Rate (%) — A small interest rate factor (like government bond yield) used for theoretical valuation.
• Table Customization — Choose table size, position, and whether to show price lines for easy visibility.
________________________________________
Step 2: Market Data & Volatility
• The tool takes the current market price (Spot Price) as input.
• It calculates realized volatility from historical price fluctuations (using past 30 bars/log returns).
• Implied Volatility (manual input) is then compared to realized vol:
o If IV > Historical Volatility → Market pricing is “expensive” (HIGH IV RANK).
o If IV < Historical Volatility → Market is “cheap” (LOW IV RANK).
o Otherwise, it’s MEDIUM.
📌 Why it matters?
Traders can decide whether buying or selling options is favorable. Beginners learn that timing entry with volatility is more critical than just looking at market direction.
________________________________________
Step 3: Black-Scholes Formula
The core engine uses the Black-Scholes model, a mathematical formula widely used to compute option fair prices.
It uses the following inputs:
• Current price (Spot)
• Strike Price
• Time to Expiry (T)
• Risk Free Rate (r)
• Implied Volatility (σ)
This produces:
• Call Option Price
• Put Option Price
📌 This teaches learners how premiums are derived theoretically and why the same strike can have different values depending on IV and time.
________________________________________
Step 4: Option Greeks Calculation
The tool computes the first order Greeks:
• Delta → Measures how much the option price changes when the underlying stock moves by 1 point.
(Call Delta ranges 0–1, Put Delta ranges -1 to 0).
• Gamma → Sensitivity of Delta to price change. A measure of volatility risk.
• Theta → Time decay. Shows how much value option loses as each day passes. Calls and Puts have negative Theta (decay).
• Vega → Measures how sensitive option price is to volatility changes.
• Rho → Interest rate sensitivity. Mostly minor in equity options but important for training.
📌 New traders learn how each factor impacts profits/losses. Instead of random guessing, they see mathematical impact in numbers.
________________________________________
Step 5: Dashboard & Visualization
The tool builds a professional dashboard table on the chart.
It shows categories such as:
1. Asset Info — Spot, Strike, DTE (days to expiry), IV%, IV Rank, 1-Day Trend, Moneyness (ATM/OTM/ITM).
2. Option Prices — Call, Put, Break-even levels, Time Value, Expected Move (%), Realized vs Implied Vol.
3. Greeks with Visual Progress Bars — Easily shows Delta, Gamma, Vega, Theta, Rho in intuitive graphical representations.
4. Status Bar — Suggests theoretical bias like:
o HIGH IV → Favor Option Selling
o LOW IV → Favor Option Buying
o MEDIUM → Neutral observation
5. Recommendation Line — Offers training-based suggestions like “Buy Straddles”, “Sell Call Spreads”, etc. These are not signals, but scenarios to learn strategies.
________________________________________
3. How It Helps Beginners
1. Learn Greeks in Action:
Beginners often memorize formulas but never see real-time changes. This dashboard updates every bar to show how Greeks change dynamically.
2. Compare Volatilities:
Traders understand difference between historical vs implied volatility and why option premiums behave differently.
3. Understand Risk Levels:
The tool highlights when Gamma risk is high (danger for sellers) or when Theta is most favorable.
4. Training Mode for Strategies:
Helps beginners experiment by changing IV, strike, expiry and seeing how straddles, spreads, naked options would behave theoretically.
5. Prepares Before Live Trading:
Safe environment to practice option analysis without risking capital.
________________________________________
4. Educational Use Cases
• Scenario 1: Change expiry from 7D to 30D — see how Theta becomes slower for longer expiries.
• Scenario 2: Increase IV from 25% to 80% — watch how option premiums inflate, and recommendation changes from “Buy” to “Sell”.
• Scenario 3: Select OTM vs ITM strikes — check how delta moves from near 0 to near 1.
By running these scenarios, learners understand why professional traders hedge Greeks instead of directional gambling.
________________________________________
5. Disclaimer
This Options Greeks Analyzer is built strictly for educational and training purposes.
• It uses theoretical formulas (Black-Scholes) that may not match actual option market prices.
• The recommendations are for learning strategy logic only, not real-world execution signals.
• Trading in options carries significant risks and may result in capital loss.
📌 Always consult with a financial advisor before applying real strategies.
________________________________________
✅ Summary
This Options Greeks Analyzer:
• Teaches how Greeks, IV, and premiums work.
• Provides a real-time interactive dashboard for training.
• Helps beginners practice option scenarios safely.
• Is meant strictly for learning and not live trading execution.
________________________________________
________________________________________
Disclaimer from aiTrendview
This script and its trading signals are provided for training and educational purposes only. They do not constitute financial advice or a guaranteed trading system. Trading involves substantial risk, and there is the potential to lose all invested capital. Users should perform their own analysis and consult with qualified financial professionals before making any trading decisions. aiTrendview disclaims any liability for losses incurred from using this code or trading based on its signals. Use this tool responsibly, and trade only with risk capital.
Compare Crypto Bollinger Bands//This is not financial advice, I am not a financial advisor.
//What are volatility tokens?
//Volatility tokens are ERC-20 tokens that aim to track the implied volatility of crypto markets.
//Volatility tokens get their exposure to an asset’s implied volatility using FTX MOVE contracts.
//There are currently two volatility tokens: BVOL and IBVOL.
//BVOL targets tracking the daily returns of being 1x long the implied volatility of BTC
//IBVOL targets tracking the daily returns of being 1x short the implied volatility of BTC.
/////////////////////////////////////////////////////////////////
CAN USE ON ANY CRYPTO CHART AS BINANCE:BTCUSD is still the most dominant crypto, positive volatility for BTC is positive for all.
/////////////////////////////////////////////////////////////////
//The Code.
//The blue line (ChartLine) is the current chart plotted on in Bollinger
//The red line (BVOLLine) plots the implied volatility of BTC
//The green line (IBVOLLine) plot the inverse implied volatility of BTC
//The orange line (TOTALLine) plots how well the crypto market is performing on the Bolling scale. The higher the number the better.
//There are 2 horizontal lines, 0.40 at the bottom & 0.60 at the top
/////////To Buy
//1. The blue line (ChartLine) must be higher than the green line (IBVOLLine)
//2. The green line (IBVOLLine) must be higher than the red line (BVOLLine)
//3. The red line (BVOLLine) must be less than 0.40 // This also acts as a trendsetter
//4. The orange line (TOTALLine) MUST be greater than the red line. This means that the crypto market is positive.
//5.IF THE BLUE LINE (ChartLine) IS GREATER THAN THE ORANGE LINE (TOTALLine) IT MEANS YOUR CRYPTO IS OUTPERFOMING THE MARKET {good for short term explosive bars}
//6. If the orange line (TOTALLine) is higher than your current chart, say BTCUSD. And BTC is going up to. It just means BTC is going up slowly. it's fine as long as they are moving in the same position.
//5. I use this on the 4hr, 1D, 1W timeframes
///////To Exit
//1.If the blue line (ChartLine) crosses under the green line (IBVOLLine) exit{ works best on 4hr,1D, 1W to avoid fakes}
//2.If the red line crosses over the green line when long. {close positions, or watch positions} It means negative volatility is wining

Boyle Trinomial Options Pricing Model [Loxx]Boyle Trinomial Options Pricing Model is an options pricing indicator that builds an N-order trinomial tree to price American and European options. This is different form the Binomial model in that the Binomial assumes prices can only go up and down wheres the Trinomial model assumes prices can go up, down, or sideways (shoutout to the "crab" market enjoyers). This method also allows for dividend adjustment.
The Trinomial Tree via VinegarHill Finance Labs
A two-jump process for the asset price over each discrete time step was developed in the binomial lattice. Boyle expanded this frame of reference and explored the feasibility of option valuation by allowing for an extra jump in the stochastic process. In keeping with Black Scholes, Boyle examined an asset (S) with a lognormal distribution of returns. Over a small time interval, this distribution can be approximated by a three-point jump process in such a way that the expected return on the asset is the riskless rate, and the variance of the discrete distribution is equal to the variance of the corresponding lognormal distribution. The three point jump process was introduced by Phelim Boyle (1986) as a trinomial tree to price options and the effect has been momentous in the finance literature. Perhaps shamrock mythology or the well-known ballad associated with Brendan Behan inspired the Boyle insight to include a third jump in lattice valuation. His trinomial paper has spawned a huge amount of ground breaking research. In the trinomial model, the asset price S is assumed to jump uS or mS or dS after one time period (dt = T/n), where u > m > d. Joshi (2008) point out that the trinomial model is characterized by the following five parameters: (1) the probability of an up move pu, (2) the probability of an down move pd, (3) the multiplier on the stock price for an up move u, (4) the multiplier on the stock price for a middle move m, (5) the multiplier on the stock price for a down move d. A recombining tree is computationally more efficient so we require:
ud = m*m
M = exp (r∆t),
V = exp (σ 2∆t),
dt or ∆t = T/N
where where N is the total number of steps of a trinomial tree. For a tree to be risk-neutral, the mean and variance across each time steps must be asymptotically correct. Boyle (1986) chose the parameters to be:
m = 1, u = exp(λσ√ ∆t), d = 1/u
pu =( md − M(m + d) + (M^2)*V )/ (u − d)(u − m) ,
pd =( um − M(u + m) + (M^2)*V )/ (u − d)(m − d)
Boyle suggested that the choice of value for λ should exceed 1 and the best results were obtained when λ is approximately 1.20. One approach to constructing trinomial trees is to develop two steps of a binomial in combination as a single step of a trinomial tree. This can be engineered with many binomials CRR(1979), JR(1979) and Tian (1993) where the volatility is constant.
Further reading:
A Lattice Framework for Option Pricing with Two State
Trinomial tree via wikipedia
Inputs
Spot price: select from 33 different types of price inputs
Calculation Steps: how many iterations to be used in the Trinomial model. In practice, this number would be anywhere from 5000 to 15000, for our purposes here, this is limited to 220.
Strike Price: the strike price of the option you're wishing to model
Market Price: this is the market price of the option; choose, last, bid, or ask to see different results
Historical Volatility Period: the input period for historical volatility ; historical volatility isn't used in the Trinomial model, this is to serve as a comparison, even though historical volatility is from price movement of the underlying asset where as implied volatility is the volatility of the option
Historical Volatility Type: choose from various types of implied volatility , search my indicators for details on each of these
Option Base Currency: this is to calculate the risk-free rate, this is used if you wish to automatically calculate the risk-free rate instead of using the manual input. this uses the 10 year bold yield of the corresponding country
% Manual Risk-free Rate: here you can manually enter the risk-free rate
Use manual input for Risk-free Rate? : choose manual or automatic for risk-free rate
% Manual Yearly Dividend Yield: here you can manually enter the yearly dividend yield
Adjust for Dividends?: choose if you even want to use use dividends
Automatically Calculate Yearly Dividend Yield? choose if you want to use automatic vs manual dividend yield calculation
Time Now Type: choose how you want to calculate time right now, see the tool tip
Days in Year: choose how many days in the year, 365 for all days, 252 for trading days, etc
Hours Per Day: how many hours per day? 24, 8 working hours, or 6.5 trading hours
Expiry date settings: here you can specify the exact time the option expires
Included
Option pricing panel
Loxx's Expanded Source Types
Related indicators
Implied Volatility Estimator using Black Scholes
Cox-Ross-Rubinstein Binomial Tree Options Pricing Model

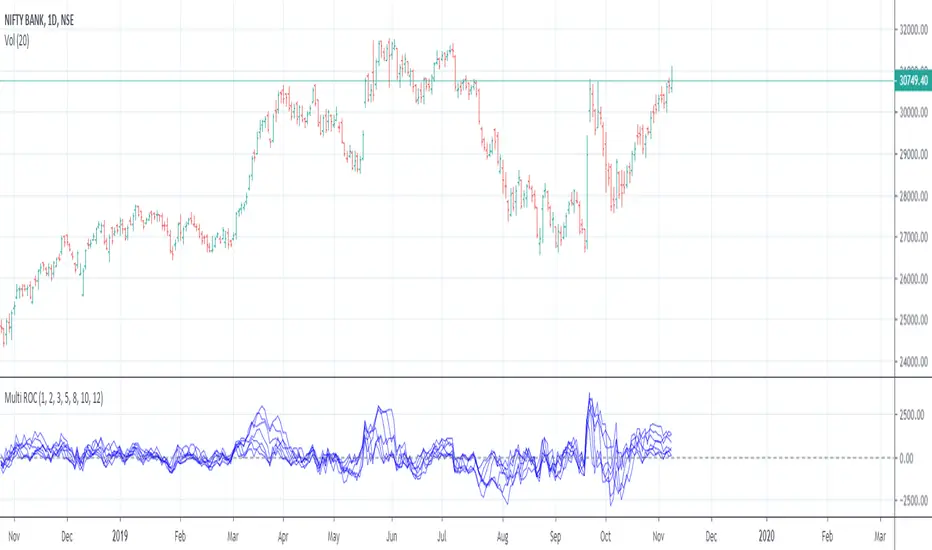
Multiple Rate Of ChangeConvergence of Multiple period Rates of Change near the Zero line shows contraction in volatility.
Soon we can expect expansion in volatility.
Ideal strategy would be to buy ATM Straddles when different period ROCs converge near Zero line.
(Also check implied volatility of options before going for this strategy)
IV Volatility History v1.2# Realized Volatility History - Quick Start Guide
## What This Does
Displays historical realized volatility (RV) calculated directly from price movements. Compare it against your current implied volatility to identify options trading opportunities and gauge whether premium is expensive or cheap.
## How to Use
1. **Get Current IV**: Check your broker's options chain and find the ATM (at-the-money) implied volatility for your ticker
2. **Input the Value**: Open indicator settings and enter the current IV (e.g., `0.15` for 15%) - this creates a reference line
3. **Read the Chart**:
- **Purple line** = Historical realized volatility from actual price movements
- **Red dashed line** = Your current ATM IV (reference)
- **Orange line** = 30-day moving average (optional)
4. **Interpret the Data**:
- **RV below IV** → Options premium is relatively expensive (consider selling premium)
- **RV above IV** → Options premium is relatively cheap (consider buying options)
- **IV Rank > 70%** → High volatility environment
- **IV Rank < 30%** → Low volatility environment
## Settings You Can Adjust
- **Current ATM IV**: Reference line for comparison (update periodically)
- **RV Rolling Window**: Calculation window for realized volatility (default: 10 days)
- **Lookback Period**: Period for IV rank calculation (default: 60 days)
- **Show 30-Day Average**: Toggle moving average line
## Limitations
This indicator requires manual IV updates since TradingView doesn't have direct access to options data. You'll need to check your broker periodically and update the input for accuracy.
---
*Method: Calculates annualized realized volatility using rolling standard deviation of log returns, providing a comparison baseline for evaluating implied volatility levels.*

IV Rank as a Label (Top Right)IV Rank (HV Proxy) – Label
Displays an IV Rank–style metric using Historical Volatility (HV) as a proxy, since TradingView Pine Script does not provide access to true per-strike implied volatility or IV Rank.
The script:
Calculates annualized Historical Volatility (HV) from price returns
Ranks current HV relative to its lookback range (default 252 bars)
Displays the result as a clean, color-coded label in the top-right corner
Color logic:
🟢 Green: Low volatility regime (IV Rank < 20)
🟡 Yellow: Neutral volatility regime (20–50)
🔴 Red: High volatility regime (> 50)
This tool is intended for options context awareness, risk framing, and volatility regime identification, not as a substitute for broker-provided IV Rank.
Best used alongside:
Options chain implied volatility
Delta / extrinsic value
Time-to-expiration analysis
Note: This indicator does not use true implied volatility data.

IV Rank (tasty-style) — VIXFix / HV ProxyIV Rank (tasty-style) — VIXFix / HV Proxy
Overview
This indicator replicates tastytrade’s IV Rank calculation—but built entirely inside TradingView.
Because TradingView does not expose live option-chain implied volatility, the script lets you choose between two widely used price-based IV proxies:
VIXFix (Williams VIX Fix): a fast-reacting volatility estimate derived from price extremes.
HV(30): 30-day annualized historical volatility of daily log returns.
The goal is to approximate the “rich vs. cheap” option volatility environment that traders use to decide whether to sell or buy premium.
Formula
IV Rank answers the question: Where is current implied volatility relative to its own 1-year range?
𝐼
𝑉
𝑅
=
𝐼
𝑉
𝑐
𝑢
𝑟
𝑟
𝑒
𝑛
𝑡
−
𝐼
𝑉
1
𝑦
𝐿
𝑜
𝑤
𝐼
𝑉
1
𝑦
𝐻
𝑖
𝑔
ℎ
−
𝐼
𝑉
1
𝑦
𝐿
𝑜
𝑤
×
100
IVR=
IV
1yHigh
−IV
1yLow
IV
current
−IV
1yLow
×100
IVcurrent: Current value of the chosen IV proxy.
IV1yHigh/Low: Highest and lowest proxy values over the user-defined lookback (default 252 trading days ≈ 1 year).
IVR = 0 → Current IV equals its 1-year low
IVR = 100 → Current IV equals its 1-year high
IVR ≈ 50 → Current IV sits mid-range
How to Use
High IV Rank (≥50–60%)
Options are relatively expensive → short-premium strategies (credit spreads, iron condors, straddles) may be more attractive.
Low IV Rank (≤20%)
Options are relatively cheap → long-premium strategies (debit spreads, calendars, diagonals) may offer better risk/reward.
Combine with your own analysis, liquidity checks, and risk management.
Inputs & Customization
IV Source: Choose “VIXFix” or “HV(30)” as the volatility proxy.
IVR Lookback: Rolling window for 1-year high/low (default 252 trading days).
VIXFix Parameters: Length and stdev multiplier to fine-tune sensitivity.
Info Label: Optional on-chart label displays current IV proxy, 1-year high/low, and IV Rank.
Alerts: Optional alerts when IVR crosses 50, falls below 20, or rises above 80.
Notes & Limitations
This indicator does not pull real option-chain IV.
It provides a close structural analogue to tastytrade’s IV Rank using price-derived proxies for markets where options data is not directly available.
For live option IV, use broker platforms or third-party data feeds alongside this script.
Tags: IV Rank, Implied Volatility, Tastytrade, VIXFix, Historical Volatility, Options, Premium Selling, Debit Spreads, Market Volatility

True Range/Expected MoveThis indicator plots the ratio of True Range/Expected Move of SPX. True Range is simple the high-low range of any period. Expected move is the amount that SPX is predicted to increase or decrease from its current price based on the current level of implied volatility. There are several choices of volatility indexes to choose from. The shift in color from red to green is set by default to 1 but can be adjusted in the settings.
Red bars indicate the true range was below the expected move and green bars indicate it was above. Because markets tend to overprice volatility it is expected that there would be more red bars than green. If you sell SPX or SPY option premium red days tend to be successful while green days tend to get stopped out. On a 1D chart it is interesting to look at the clusters of bar colors.

IV/HV ratio 1.0 [dime]This script compares the implied volatility to the historic volatility as a ratio.
The plot indicates how high the current implied volatility for the next 30 days is relative to the actual volatility realized over the set period. This is most useful for options traders as it may show when the premiums paid on options are over valued relative to the historic risk.
The default is set to one year (252 bars) however any number of bars can be set for the lookback period for HV.
The default is set to VIX for the IV on SPX or SPY but other CBOE implied volatility indexes may be used. For /CL you have OVX/HV and for /GC you have GVX/HV.
Note that the CBOE data for these indexes may be delayed and updated EOD
and may not be suitable for intraday information. (Future versions of this script may be developed to provide a realtime intraday study. )
There is a list of many volatility indexes from CBOE listed at:
www.cboe.com
(Some may not yet be available on Tradingview)
RVX Russell 2000
VXN NASDAQ
VXO S&P 100
VXD DJIA
GVX Gold
OVX OIL
VIX3M 3-Month
VIX6M S&P 500 6-Month
VIX1Y 1-Year
VXEFA Cboe EFA ETF
VXEEM Cboe Emerging Markets ETF
VXFXI Cboe China ETF
VXEWZ Cboe Brazil ETF
VXSLV Cboe Silver ETF
VXGDX Cboe Gold Miners ETF
VXXLE Cboe Energy Sector ETF
EUVIX FX Euro
JYVIX FX Yen
BPVIX FX British Pound
EVZ Cboe EuroCurrency ETF Volatility Index
Amazon VXAZN
Apple VXAPL
Goldman Sachs VXGS
Google VXGOG
IBM VXIBM

Options Visualizer: Smart Money Barriers [V6]Options Visualizer: Institutional Barriers & Expected Move
The Options Visualizer is analysis tool designed for traders who want to gain an edge by monitoring the "Smart Money" (options market makers and institutional hedgers). This script helps you visualize key option market dynamics directly on your chart, allowing you to see statistical support/resistance levels and massive "walls" of liquidity.
Key Features
1. Institutional Walls (Manual Mode)
Input high Open Interest (OI) data from exchanges like Deribit or Coinglass.
Call Wall (Resistance): The strike price with the highest concentration of Call options. Market makers often defend these levels to prevent paying out buyers.
Put Wall (Support): The strike price with the highest concentration of Put options, acting as a "floor" for price action.
2. Auto-Probability Mode (Statistical Barriers)
Enable Auto Mode to calculate theoretical barriers based on a 2-Standard Deviation (95% Probability) model.
This visualizes the "extreme" ends of market expectations, where a reversal or significant resistance is mathematically likely.
3. Expected Move (68% Range Box)
The blue dotted box represents the 1-Standard Deviation (68% probability) move.
Historically, 68% of the time, the price at expiration will settle within this range. Staying outside this box signals an "over-extended" market.
The Math Behind the Magic
The script utilizes the standard Expected Move formula used by professional floor traders:
Expected Move = Current Price * (IV / 100) * SquareRoot(Days To Expiry / 365)
68% Probability (The Blue Box): Derived from 1-Standard Deviation (1-Sigma). It assumes a normal distribution of price returns.
95% Probability (Auto Mode Walls): Derived from 2-Standard Deviations (2-Sigma). This covers the vast majority of expected market outcomes, making these levels powerful institutional-grade support and resistance zones.
Implied Volatility (IV): Unlike historical volatility, IV represents the market's forward-looking "fear gauge" based on option pricing.
How to Use This Tool
1. Setup:
Look up the current Implied Volatility (IV) and Max Pain/Open Interest for your asset (use Coinglass or Deribit Metrics).
2. Inputs:
Enter the Days Until Expiration (e.g., if monthly options expire this Friday, enter the remaining days).
Enter the IV % (e.g., 55 for 55%).
3. Execution:
Trend Trading: If price stays within the Blue Box, the trend is "normal."
Mean Reversion: If price hits the Call/Put Wall (Red/Green dashed lines), look for exhaustion and potential reversal signals.
Breakouts: A sustained candle close outside the 95% Auto Walls suggests a "Black Swan" event or a massive short/gamma squeeze.
Why Use This Tool?
Traditional indicators (RSI, MACD) look at the past. This tool looks at current market expectations and positioning. By seeing where the "walls" are built, you can significantly improve your risk management and trading edge.
MANUAL:
Mode 1: Manual Institutional Data (Recommended for Specific Expiries)
This mode uses real-world Open Interest (OI) data, offering the most accurate view of where large institutions are actively defending their positions.¨
🛑 How to use the Manual Mode:
1. Disable the Enable Auto Probability Mode checkbox in the indicator settings.
2. Find the Data: Navigate to specialized crypto options analytics websites:
Coinglass Options (Look for "Open Interest by Strike")
Deribit Metrics (Look for Max Pain charts)
3. Identify Key Levels & Input them into the script settings:
Manual Call Wall Strike: Find the Highest Red Bar on the OI chart. This is the strike price with the most Call options, acting as massive institutional resistance.
Manual Put Wall Strike: Find the Highest Green Bar on the OI chart. This is the strike price with the most Put options, acting as a solid price floor (support).
Manual Max Pain Level: Locate the value labeled as Max Pain on the source website. This is the price where the most options would expire worthless for buyers.
Mode 2: Auto Probability Barriers (Statistical Mode)
If you don't want to manually input data, the Auto Mode calculates theoretical barriers based purely on math and volatility, providing highly probable, yet slightly less precise, support/resistance levels.
✅ How to use the Auto Mode:
Enable the Enable Auto Probability Mode checkbox in the indicator settings.
The script will automatically set the Call/Put Walls at the 2-Standard Deviation (95% probability) range.
You still need to update the Implied Volatility (IV) % and Days Until Expiration to ensure the calculations are accurate for today's market conditions.

NY VIX Channel Trend US Futures Day Trade StrategyNY VIX Channel Trend Strategy
Summary in one paragraph
Session anchored intraday strategy for index futures such as ES and NQ on one to fifteen minute charts. It acts only after the first configurable window of New York Regular Trading Hours and uses a VIX derived daily implied move to form a realistic channel from the session open. Originality comes from using a pure implied volatility yardstick as portable support and resistance, then committing in the direction of the first window close relative to the open. Add it to a clean chart and trade the simple visuals. For conservative alerts use on bar close.
Scope and intent
• Markets. Index futures ES and NQ
• Timeframes. One to thirty minutes
• Default demo. ES1 on five minutes
• Purpose. Provide a portable intraday yardstick for entries and exits without curve fitting
• Limits. This is a strategy. Orders are simulated on standard candles
Originality and usefulness
• Unique concept. A VIX only channel anchored at 09:30 New York plus a single window trend test
• Addresses. False urgency at session open and unrealistic bands from arbitrary multipliers
• Testability. Every input is visible and the channel is plotted so users can audit behavior
• Portable yardstick. Daily implied move equals VIX percent divided by square root of two hundred fifty two
• Protected status. None. Method and use are fully disclosed
Method overview in plain language
Take the daily VIX or VIX9D value, convert it to a daily fraction by dividing by square root of two hundred fifty two, then anchor a symmetric channel at the New York session open. Observe the first N minutes. If that window closes above the open the bias is long. If it closes below the open the bias is short. One trade per session. Exits occur at the channel boundary or at a bracket based on a user selected VIX factor. Positions are closed a set number of minutes before the session ends.
Base measures
Return basis. The daily implied move unit equals VIX percent divided by square root of two hundred fifty two and serves as the distance unit for targets and stops.
Components
• VIX Channel. Top, mid, bottom lines anchored at 09:30 New York. No extra multipliers
• Window Trend. Close of the first N minutes relative to the session open sets direction
• Risk Bracket. Take profit and stop loss equal to VIX unit times user factor
• Session Window. Uses the exchange time of the chart
Fusion rule
Minimum gates count equals one. The trade only arms after the window has elapsed and a direction exists. One entry per session.
Signal rule
• Long when the window close is above the session open and the window has completed
• Short when the window close is below the session open and the window has completed
• Exit on channel touch. Long exits at the top. Short exits at the bottom
• Flat thirty minutes before the session close or at the user setting
Inputs with guidance
Setup
• Use VIX9D. Width source. Typical true for fast tone or false for baseline
• Use daily OPEN. Toggle for sensitivity to overnight changes
Logic
• Window minutes. Five to one hundred twenty. Larger values delay entries and reduce whipsaw
• VIX factor for TP. Zero point five to two. Raising it widens the profit target
• VIX factor for SL. Zero point five to two. Raising it widens the stop
• Exit minutes before close. Fifteen to ninety. Raising it exits earlier
Properties visible in this publication
• Initial capital one hundred thousand USD
• Base currency USD
• request.security uses lookahead off
• Commission cash per contract two point five $ per each contract. Slippage one tick
• Default order size method FIXED with value one contract. Pyramiding zero. Process orders on close ON. Bar magnifier OFF. Recalculate after order is filled OFF. Calc on every tick ON
Realism and responsible publication
No performance claims. Past results never guarantee future outcomes. Fills and slippage vary by venue. Shapes can move while a bar forms and settle on close. Strategy uses standard candles.
Honest limitations and failure modes
Economic releases and thin liquidity can break the channel. Very quiet regimes can reduce signal contrast. Session windows follow the exchange time of the chart. If both stop and target can be hit within one bar, assume stop first for conservative reading without bar magnifier.
Works best in liquid hours of New York RTH. Very large gaps and surprise news may exceed the implied channel. Always validate on the symbols you trade.
Entries and exits
• Entry logic. After the first window, go long if the window close is above the session open, go short if below
• Exit logic. Long exits at the channel top or at the take profit or stop. Short exits at the channel bottom or at the take profit or stop. Flat before session close by the configured minutes
• Risk model. Initial stop and target based on the VIX unit times user factors. No trail and no break even. No cooldown
• Tie handling. Treat as stop first for conservative interpretation
Position sizing
Fixed size one contract per trade. Target risk per trade should generally remain near one percent of account equity. Risk is based on the daily volatility value, the max loss from the tests for one year duration with 5min chart was 4%, while the avg loss was below <1% of the total capital.
If you have any questions please let me know. Thank you for coming by !

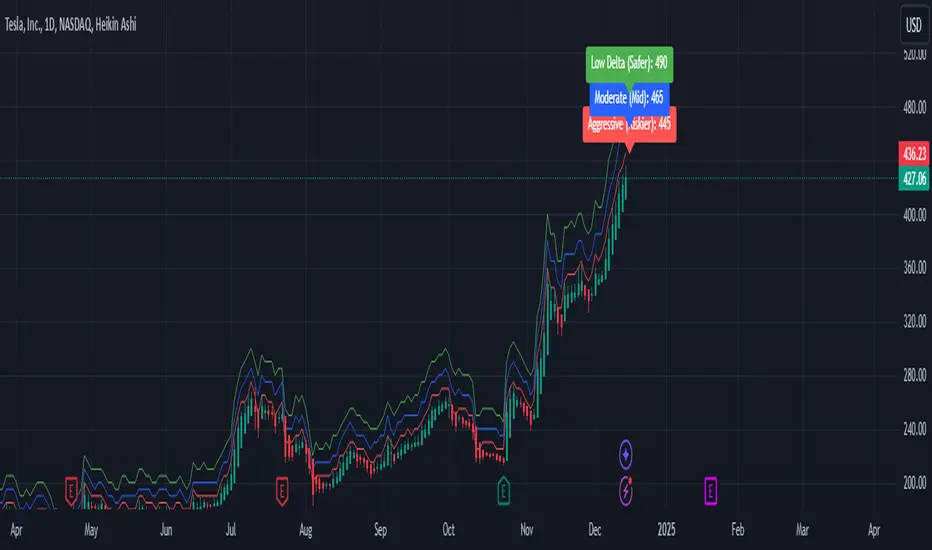
Weekly Covered Calls Strategy with IV & Delta LogicWhat Does the Indicator Do?
this is interactive you must use it with your options chain to input data based on the contract you want to trade.
Visualize three strike price levels for covered calls based on:
Aggressive (closest to price, riskier).
Moderate (mid-range, balanced).
Low Delta (farthest, safer).
Incorporate Implied Volatility (IV) from the options chain to make strike predictions more realistic and aligned with market sentiment. Adjust the risk tolerance by modifying Delta inputs and IV values. Risk is defined for example .30 delta means 30% chance of your shares being assigned. If you want to generate steady income with your shares you might want to lower the risk of them being assigned to .05 or 5% etc.
How to Use the Indicator with the Options Chain
Start with the Options Chain:
Look for the following data points from your options chain:
Implied Volatility (IV Mid): Average IV for a particular strike price.
Delta:
~0.30 Delta: Closest strike (Aggressive).
~0.15–0.20 Delta: Mid-range strike (Moderate).
~0.05–0.10 Delta: Far OTM, safer (Low Delta).
Strike Price: Identify strike prices for the desired Deltas.
Open Interest: Check liquidity; higher OI ensures tighter spreads.
Input IV into the Indicator:
Enter the IV Mid value (e.g., 0.70 for 70%) from the options chain into the Implied Volatility field of the indicator.
Adjust Delta Inputs Based on Risk Tolerance:
Aggressive Delta: Increase if you want strikes closer to the current price (riskier, higher premium).
Default: 0.2 (20% chance of shares being assigned).
Moderate Delta: Balanced risk/reward.
Default: 0.12 (12%)
Low Delta: Decrease for safer, farther OTM strikes.
Default: 0.05 (5%)
Visualize the Chart:
Once inputs are updated:
Red Line: Aggressive Strike (closest, riskiest, higher premium).
Blue Line: Moderate Strike (mid-range).
Green Line: Low Delta Strike (farthest, safer).
Step-by-Step Workflow Example
Open the options chain and note:
Implied Volatility (IV Mid): Example 71.5% → input as 0.715.
Delta for desired strikes:
Aggressive: 0.30 Delta → Closest strike ~ $455.
Moderate: 0.15 Delta → Mid-range strike ~ $470.
Low Delta: 0.05 Delta → Farther strike ~ $505.
Open the indicator and adjust:
IV Mid: Enter 0.715.
Aggressive Delta: Leave at 0.12 (or adjust to bring strikes closer).
Moderate Delta: Leave at 0.18.
Low Delta: Adjust to 0.25 for safer, farther strikes.
View the chart:
Compare the indicator's strikes (red, blue, green) with actual options chain strikes.
Use the visualization to: Validate the risk/reward for each strike.
Align strikes with technical trends, support/resistance.
Adjusting Inputs Based on Risk Tolerance
Higher Risk: Increase Aggressive Delta (e.g., 0.15) for closer strikes.
Use higher IV values for volatile stocks.
Moderate Risk: Use default values (0.12–0.18 Delta).
Balance premiums and probability.
Lower Risk: Increase Low Delta (e.g., 0.30) for farther, safer strikes.
Focus on higher IV stocks with good open interest.
Key Benefits
Simplifies Strike Selection: Visualizes the three risk levels directly on the chart.
Aligns with Market Sentiment: Incorporates IV for realistic forecasts.
Customizable for Risk: Adjust inputs to match personal risk tolerance.
By combining the options chain (IV, Delta, and liquidity) with the technical chart, you get a powerful, visually intuitive tool for covered call strategies.
IV PercentileIV Percentile Indicator - Brief Description
What It Does
The IV Percentile Indicator measures where current implied volatility ranks compared to the past year, showing what percentage of time volatility was lower than today's level.
How It Works
Data Collection:
Tracks implied volatility (or historical volatility as proxy) for each trading day
Stores the last 252 days (1 year) of volatility readings
Uses VIX data for SPY/SPX, historical volatility for other stocks
Calculation:
IV Percentile = (Days with IV below current level) ÷ (Total days) × 100
Example: If IV Percentile = 75%, it means current volatility is higher than 75% of the past year's readings.
Visual Output
Main Display:
Blue line showing percentile (0-100%)
Reference lines at key levels (20%, 30%, 50%, 70%, 80%)
Color-coded backgrounds for quick identification
Info table with current readings
Key Levels:
80%+ (Red): Very high IV → Sell premium
70-79% (Orange): High IV → Consider selling
30-20% (Green): Low IV → Consider buying
<20% (Bright Green): Very low IV → Buy premium
Trading Application
When IV Percentile is HIGH (70%+):
Options are expensive relative to recent history
Good time to sell premium (iron condors, credit spreads)
Expect volatility to decrease toward normal levels
When IV Percentile is LOW (30%-):
Options are cheap relative to recent history
Good time to buy premium (straddles, long options)
Expect volatility to increase from compressed levels
Core Logic
The indicator helps answer: "Is this a good time to buy or sell options based on how expensive/cheap they are compared to recent history?" It removes the guesswork from volatility timing by providing historical context for current option prices.
